
Source:
A Review of Canada’s Ship-Source Oil Spill Preparedness and Response Regime. Setting the Course for the Future. Published by Tanker Safety Panel Secretariat, Ottawa. 2013
www.tc.gc.ca/eng/tankersafetyexpertpanel/menu.htm
This 32 page report presents the Gulf of St. Lawrence as a unique marine ecosystem that features complex oceanographic processes and also maintains a high biological diversity of marine life. The information provided covers physical systems such as the properties of water, physical oceanography and geological components. The biological aspects include descriptions of macrophytic, planktonic and benthic communities, reptiles, fish, marine birds and mammals. There is also a discussion on the human components such as settlement, industrial activity and governance. By providing relevant information in this format the report highlights the challenge of managing multiple human activities within the context of a dynamic, diverse and unique marine ecosystem. It was produced by Fisheries and Oceans Canada in 2005.
Gulf of St. Lawrence A Unique Ecosystem DFO

![]()
April 4, 2013
This beautiful ecological narrative and photographic essay describes the Gulf of St. Lawrence and the St. Lawrence River. The author highlights this productive ecosystem’s krill, whales, human culture, landscapes, geological history, currents, tides, endangered species and the need for the precautionary principle. This article gives us a good understanding of the ecology of the Gulf. A must read!
From Gary Merriam’s Ecological Blog
Gray Merriam, Ph.D., D.Sc., Professor Emeritus in Landscape Ecology and Environmental Science, has published about fifty scientific papers and book chapters, and is a past-president of the International Association of Landscape Ecologists (IALE). He holds awards for Distinguished Landscape Ecologist form the U.S. chapter of the association. Gray lives on the Salmon River, Ontario, with his wife, Aileen, painter and lake steward.
In the Estuary and Gulf of St. Lawrence, the biological diversity is remarkable, and reflects this vast area’s wide range of environmental conditions. There, each species has a suitable environment for its survival, and the combination of the environment’s characteristics makes up its habitat. Some of these species are at risk, and so they are protected by the Species at Risk Act. When a species is at risk, its habitat must be protected to facilitate its recovery. But what exactly is this habitat? Where is it, and what are its characteristics?
To protect a species’s habitat, it is first necessary to locate it, then to define its main characteristics. This is what Jean-Denis Dutil’s team worked on for almost a year at the Maurice Lamontagne Institute in Mont-Joli. After making an inventory of the existing data, the researcher and his team created a large database with information on several parameters. Relief, depth, seabed nature and slope, salinity, temperature, and oxygen availability are only a few of the sixty or so variables compiled to describe an area extending over 225 000 km2.
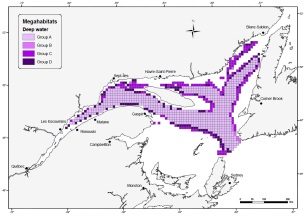
The data were organized spatially: the area covered was divided into cells of 10 km by 10 km (100 km2). Using the 2432 cells for which all the data were available, the researchers then defined the main habitat types, which they named megahabitats. These habitats are groups of cells with the same characteristics. In order to identify the habitats, all of the cells were first divided into two main groups. Then, both of the two groups were further divided into two, and so on and so on, according to their environmental properties. In the end, the research team identified 13 main megahabitats, as shown in Figure 1.
While many scientific disciplines had a way to describe specific aspects of the habitat of at-risk species, no one to date had a general overview. The database compiled by Mr. Dutil’s team was designed specifically to remedy this situation. This project has provided a spatially integrated database, allowing the user to identify which habitat each of the 2432 cells belongs to, as well as its characteristics. The georeferenced data can be mapped variable by variable, or cells that meet a specific set of criteria can be selected, simply by inputting catch data spatially, i.e. by cell, to assess each habitat’s contribution to each species examined, for example, an at-risk species. Each megahabitat corresponds to a specific species assemblage.
Spatial distribution of megahabitats (Source: DFO)
 B: Shallow water areas, southern Gulf
 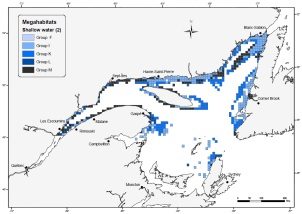 C: Shallow water areas, lower estuary and northern Gulf
The habitat characterization exercise is currently being conducted in order to better define coastal and pelagic areas (less than 30 m deep). This time, 128 variables and 39 337 6.25-km2 cells are being used to analyze the area. Constant referential improvement will make it a powerful tool for protecting critical habitats of at-risk species using an ecosystem-based approach. This approach considers not only the species to protect, but also those it depends on or in its environment, as well as their habitat.
This project’s full report is available at:
http://www.dfo-mpo.gc.ca/csas/

“In the Gulf, We are All Neighbours” is proven on this custom made map created by the St. Lawrence Coalition Saint-Laurent. As neighbours, we have a responsibility to keep the Old Harry proposed drill site OUT of our collective waters, shared between 5 provinces and First Nations territories.

February 13, 2013 NASA image by Jeff Schmaltz, LANCE/EOSDIS MODIS Rapid Response.
Every year, Arctic sea ice shrinks and grows, reaching its minimum in September and its maximum in February or March. As sea ice nears its maximum, it often begins to form in Canada’s Gulf of St. Lawrence.
Young sea ice is typically thin enough to be easily moved by winds and currents, and such ice often takes on serpentine shapes. Delicate swirls of ice are especially noticeable in this image south of Île d’Anticosti. Closer to Prince Edward Island, the ice appears thicker, likely forming in the area thanks to frigid northerly winds. Sea ice is also visible off Newfoundland, but it may have formed to the north and drifted southward along the Labrador coast.
Info from NASA Earth Observatory
Congress on the oil spill in the Gulf of Mexico: dismal assessment almost 3 years after the Deepwater Horizon disaster
By Danielle Giroux and Sylvain Archambault,
Co-spokespersons for the St. Lawrence Coalition
More than 1000 scientists gathered in the Gulf of Mexico Oil Spill and Ecosystem Science Conference in New Orleans, Louisiana (21-23 January 2013) for an update on the status of the situation after the April 20th oil spill 2010.

Danielle Giroux and Sylvain Archambault,
Spokespersons for the St. Lawrence Coalition
The St. Lawrence Coalition participated in the event and gave a lecture. We report here the grim toll of the oil spill in the Gulf of Mexico and its communities.
We would have wished to be reassured, but the impacts are even more extensive and important than what we thought. The list is long: loss of biodiversity, increased erosion of marshes, dramatic drop in shrimp populations in some areas, markets still closed in some areas, fishing boats for sale, communities and families devastated, physical and mental health problems, financial stress, many terrestrial and marine organisms affected, whether bacteria, insects, plankton, coral, jellyfish, fish, shellfish, birds, etc.
The worst thing is that it is not over! The dispersant has fragmented the oil that is now found in the sediment at the bottom of the sea. During storms, it goes back up, therefore exposing marine and terrestrial organisms again, not to mention the marshes that are still contaminated.
The lack of knowledge of the state of the Gulf before the spill poses a major problem for scientists who have little comparative data to carry out their work. Despite hundreds of ongoing research, science still offers little answers to many questions. Decades may be needed before drawing a proper assessment of the impacts.
The St. Lawrence Coalition was invited to give a lecture that was given by Sylvain Archambault. A poster was also presented by the Coalition. People’s reaction to our presentation was fantastic! We received a lot of support from scientists who told us not to repeat the mistake of the Gulf of Mexico and not to start drilling in the Gulf of St. Lawrence as it is not too late for us. A scientist of BP congratulated us for our presentation and warned us about drilling in the Gulf of St. Lawrence.
Moreover, it was disturbing to hear Dr. John Farrigton, a leading oceanographer, telling us that there is a reasonable chance that a similar accident occurs.
We learned from this experience that the impacts of the spill are unknown, tragic and devastating at all levels: social, environmental and economic. The situation is far from being restored. We also learned that the experience of the tragic oil spill will probably allow Americans to be better prepared to face a new catastrophe, but unfortunately not avoid it.
Some data: – There are approximately 4,000 wells in the Gulf of Mexico – Only 38% of 947,892 claims have been settled to date – Economic impact of the oil spill on fisheries estimated at $ 8.7 billion.
– Level of consumer confidence after the spill: in 2012, only 23% of consumers believe that the seafood is safe
– The dispersant and oil are more toxic than the dispersant or oil alone
– Cost of oil spill: $ 40 billion.
Map of Artificial Borders to Allow Offshore Oil and Gas Development
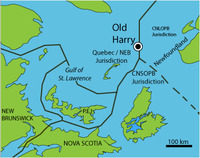
Credit: David Suzuki Foundation
As stated by the David Suzuki Foundation “According to the current legislative processes in place, the boundaries of the five gulf provinces (Quebec, Newfoundland and Labrador, Prince Edward Island, New Brunswick and Nova Scotia) are established by artificial legal borders in order to allow offshore hydrocarbon development. This means that these different jurisdictions issue hydrocarbon prospecting and operating licenses independently from one another.”
(Note that this map, and many others exclude representation of First Nations’ claims to the Gulf of St. Lawrence.)